Graphical Analysis on Chromebooks
- May 10, 2017
- 2 min read
Science is something we all take throughout high school. With our switch to Google Chromebooks next year we will need to know how to use new apps like Google Suite, Kami, and Google Class, if we don’t already know how. In biology, chemistry, and AP chem, I know teachers are starting to use an app called Graphical Analysis that has a lot of plugins to use. I know of the one that records the temperature and the one that records the pH, but I’m sure there may be a couple others. In this I will teach you some of the many things you can do using this app.
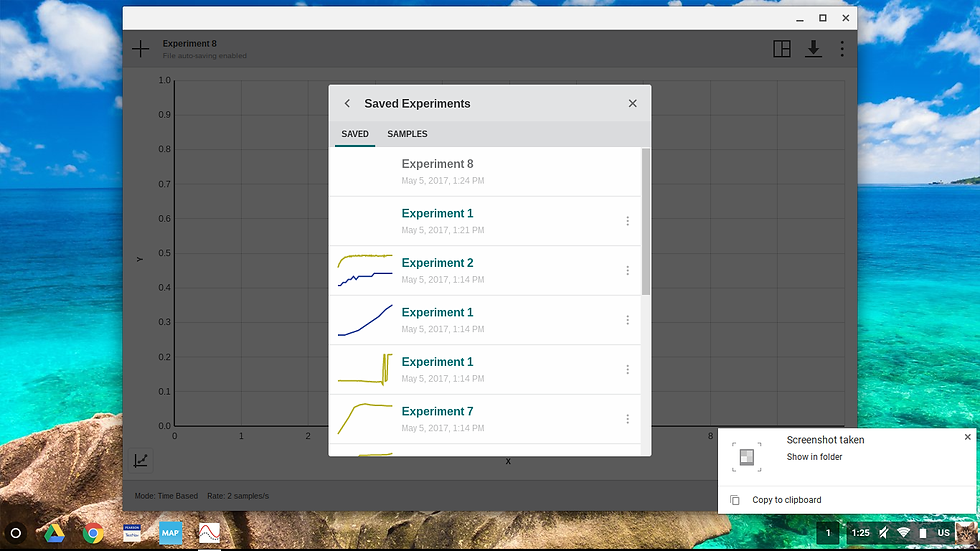
When you open the app it will pop up a screen, THIS SCREEN CAN BECOME IMPORTANT! It will let you choose from entering data manually, collecting the data using a USB plugin, or sharing your data, but that’s not all! Everything you record in this app, like Google Docs, saves automatically. This means if you accidentally exit, have to finish in a different class, or you just forgot to record your data you don’t have to worry. The screen that pops up at the beginning lets you open saved documents. As long as you remember to name your projects you’ll have no trouble finding it.

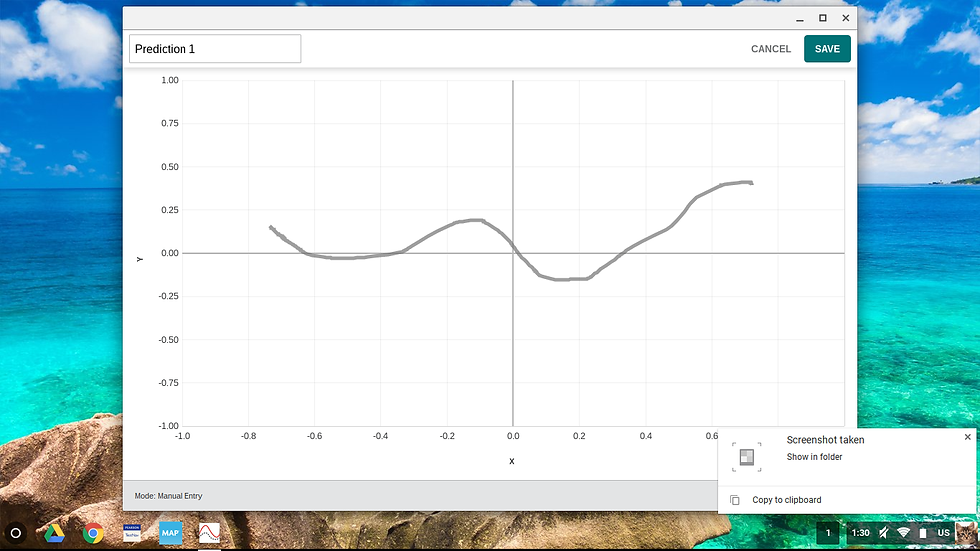
Manual entry is just what it sounds like, you will enter your X and Y points without the use of a plugin. To title this graph hit the button at the bottom left that looks like a graph and add a title. You can also change the appearance to lines, points, or both (a line with points on it). Of course you can change the range of X and Y too. Another thing you can do on here is add a prediction. Before you take your data Draw a prediction of what your graph will look like, then after you take the data you can enter it and see if you were close!


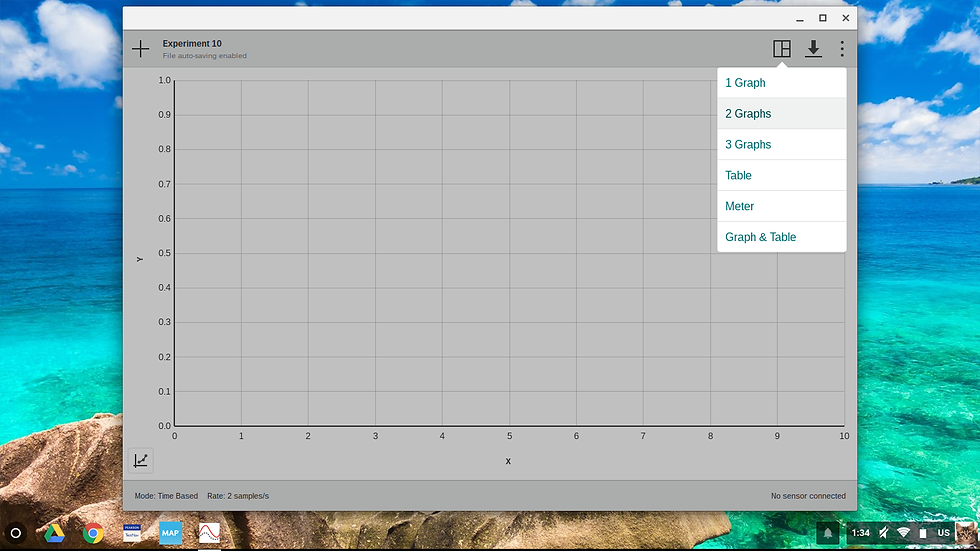
The one I’m pretty sure you’ll use more often is the sensor data collection. Your teacher will give you what you need to plug in. At the top of the screen you can press record when you are ready to record data, but know it’ll stop recording at 180 seconds. Other than that the graphing tools are the same. You can make a prediction and change titles and appearances. Something else you can do on either manual or plugin that I think is more helpful on plugin is adding a graph. You can add up to three graphs to compare side by side. Press the box at the top right to get that. You can also change from a graph to a table, meter, or a table and a graph depending on what data you are collecting.

After you have a graph you might need to send it to your teacher. As many teachers already use Google Class, this is how you can get it to your Google Drive. You are going to go to the down arrow at the top right of the screen and click download data. Then it will let you choose where in your drive you want to save it. From there you can easily send it to your teacher.

Any extra questions? Email: techhelpdesk@rsu57.org :) Happy Sciencing!


Comments